Metal prices: how to interpret the price of gold and silver and understand their evolution
Precious metal prices make headlines almost every day. Historic rises, sharp corrections, new highs... The price of gold and silver seems to move constantly, yet it is often interpreted superficially. We look at the figure, but not the context. We look at the data point, but not the trend.
In reality, understanding the gold or silver price requires a deeper reading. The value we see on the screen - "today's price" - only makes sense when it is analyzed in the context of its evolution over time. That is why, in this article, we will take the included chart as a reference, both in its 1-year view and in its 10-year perspective. That is where the market's behavior is truly understood.
Gold and silver are not simply commodities. They are assets with monetary, historical and psychological dimensions. They have been a store of value for centuries, have underpinned monetary systems and today continue to act as a thermometer of confidence in currencies and economic policies. Their movements reflect central bank decisions, inflation expectations, geopolitical tensions and changes in the global economy.
From a numismatic (coin investment) perspective, moreover, the exchange rate is not an abstract datum. It is the basis on which the intrinsic value of bullion coins and bullion coins is built, and the starting point for understanding how the physical market evolves.
In the following lines we will analyze how to correctly interpret the gold and silver chart, what factors are behind their movements and why the recent volatility is not a coincidence, but the result of well-defined economic forces.
Gold price today: analysis and influencing factors
When looking at gold's one-year chart, the first question to ask is not how much it is worth today, but what phase of the cycle it is in. Is it in a consolidated uptrend? A correction within a larger move? Or a sideways accumulation phase?
Gold is an asset deeply influenced by monetary policy and real interest rates. When real rates fall - i.e. when inflation-adjusted bond yields fall - gold's relative attractiveness increases. It does not earn interest, but neither does it depend on the financial system. That neutrality is precisely its strength in certain environments.
The yearly chart usually shows strong movements associated with decisions or expectations of central banks such as the Federal Reserve or the European Central Bank. When the market anticipates rate cuts or more expansionary monetary policies, gold tends to react strongly.
However, the real perspective is obtained by extending the horizon to 10 years. On that scale, minor oscillations are diluted and major structural cycles appear. This is where we see how gold alternates phases of prolonged expansion with periods of consolidation or adjustment. In the long term, its behavior has been linked to episodes of monetary mistrust, financial crises or persistent inflation.
For the numismatically sensitive reader, this analysis is not purely financial. In prolonged bull cycles, the intrinsic value of bullion coins increases, but premiums may behave differently depending on physical supply and demand. In periods of financial stress, even modern-issue coins can see their premium over the spot price increase.
Silver price today
Silver shares with gold its historical role as a monetary metal, but its behavior on the chart is significantly different. When we look at the 1-year evolution, volatility is usually more evident. The swings are wider, the movements faster and the corrections more abrupt.
This is due to its dual nature. Silver is not only an investment asset or store of value; it is also an industrial metal widely used in electronics, energy, chemical and technological applications. That combination makes it a hybrid asset, influenced by both financial factors and physical supply and demand dynamics.
On the 10-year chart, silver shows more amplified cycles than gold. When gold enters a structural bull phase, silver usually accompanies it with higher percentage movements. But in phases of economic contraction or monetary tightening, it can also correct more sharply.
For the silver coin investor, this means understanding that the metal value can fluctuate more strongly, while the premium will depend on additional factors such as product availability, retail demand and the general economic backdrop.
How is the price of Gold and Silver traded?
Understanding the chart requires understanding how the price is formed. Gold and silver are not traded in a single centralized physical market, but in a network of interconnected markets.
The reference price we see reflected in the chart is usually derived from the international spot market, which is heavily influenced by the trading of futures contracts in major financial centers. These markets provide liquidity and hedging for producers, refiners and financial institutions.
In addition, there is a widely used institutional benchmark: the one set by the London Bullion Market Association, known as LBMA Gold Price, which establishes a reference price through an electronic auction process.
However, it is important to understand that the investor or collector who acquires physical metal does not pay exactly that price. Between the theoretical quotation and the real price, there are manufacturing premiums, logistics, commercial margins and, in some cases, taxes. In the numismatic field, historical value, rarity and conservation can significantly move the final price away from the mere intrinsic value of the metal.
Factors influencing share price: why is there so much volatility lately?
The volatility observed in recent years responds to a combination of macroeconomic, geopolitical and technical factors.
Monetary policy remains the main driver. Changes in expectations about interest rates, future inflation or economic growth generate rapid adjustments in the positions of funds and institutional traders. Gold, because it does not generate yield, competes directly with fixed income assets; any change in its relative attractiveness is quickly reflected in the chart.
This is compounded by geopolitical and financial uncertainty. In times of international tension or doubts about the stability of the financial system, the demand for safe-haven assets increases. Gold benefits from this perception of security, while silver can react more ambivalently due to its industrial component.
In the case of silver, volatility is amplified when industrial tensions coincide with financial factors. Changes in technological demand, adjustments in mining production or alterations in supply chains can generate abrupt movements.
Finally, the role of speculative trading should not be underestimated. Derivatives markets allow leveraged positions that, in uncertain environments, can accelerate both upward and downward movements.
Relationship between inflation and precious metals
The relationship between inflation and gold is one of the most persistent debates in financial economics. In the long term, gold has shown its ability to preserve purchasing power. The 10-year chart shows how it responds in environments of monetary expansion or loss of confidence in the currency.
However, the correlation is not automatic in the short term. It is not only inflation that is decisive, but also the reaction of central banks to it. If inflation rises but real rates rise, gold may lose relative attractiveness. On the other hand, if inflation rises while real rates remain low or negative, gold tends to strengthen.
Silver, on the other hand, combines this monetary component with the industrial cycle. In periods of inflation accompanied by economic growth, it can benefit from both its monetary nature and the increase in industrial demand. But in scenarios of stagflation or industrial contraction, its behavior may differ from that of gold.
Other precious metals to consider
Beyond gold and silver, there are other metals that, although less present in the general conversation, play a relevant role in the markets.
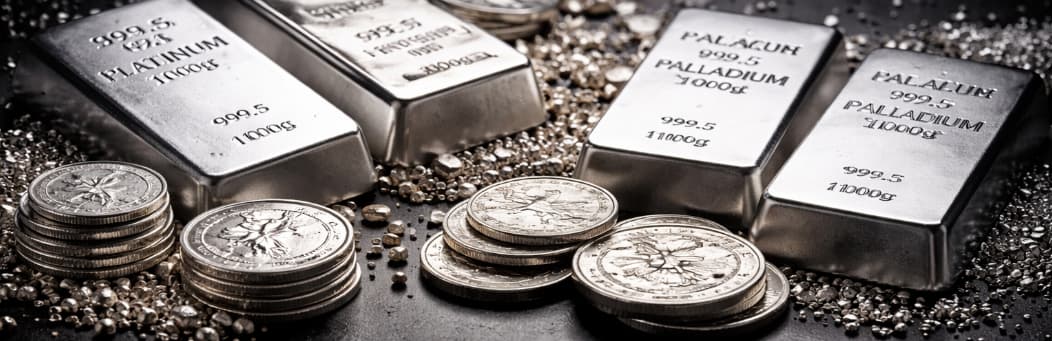
Platinum and palladium are strongly linked to the industrial sector, especially the automotive and chemical sectors. Their prices can be more sensitive to regulatory, technological or mining supply changes. Rhodium, with a much smaller market, is known for episodes of extreme volatility when supply is stressed.
For the specialized investor or the advanced numismatist, following the evolution of these metals on the long-term chart makes it possible to detect cyclical dynamics that do not always coincide with those of gold.
Final thought
Observing the price of gold or silver without context is like analyzing an ancient coin only by its weight: we obtain a piece of data, but we do not understand its history. The real interpretive value lies in the evolution, in reading the cycle and understanding the forces at work behind the price.
Gold and silver do not move by chance. They respond to real interest rates, expansionary or restrictive monetary policies, geopolitical tensions, industrial dynamics and strategic decisions of central banks. When these factors converge, volatility increases; when they stabilize, the market consolidates.
For the investor, understanding this framework avoids impulsive decisions motivated by headlines or spikes. For the numismatist, it provides an additional layer of analysis: metal value is only part of the equation, but it is the foundation on which everything else is built. Knowing where we are in the cycle helps to contextualize premiums, physical demand and secondary market behavior.
Ultimately, interpreting precious metals prices correctly involves changing the question. It is not just a question of "how much is it worth today", but "why is it worth today" and, above all, "what is its evolution telling us". That is the difference between following the price... and understanding the market.